In the world of business, keeping an eye on competitors‘ patents is crucial for understanding their plans, especially in research and development. By looking at these patents, companies can get a good idea of what their competitors are up to and how strong they are in terms of new technologies. This process involves a few key steps:
- Spotting new technology trends that competitors might be exploring.
- Comparing your company’s technology to what competitors are doing.
- Noticing any changes in how competitors approach technology development.
To make this more practical, consider these questions: How can a company quickly identify the latest technological advancements in its industry? What are effective ways to measure a company’s technological progress against its competitors?
The Evolution of Patent Indicators: Gaining Deeper Insights from Patent Data
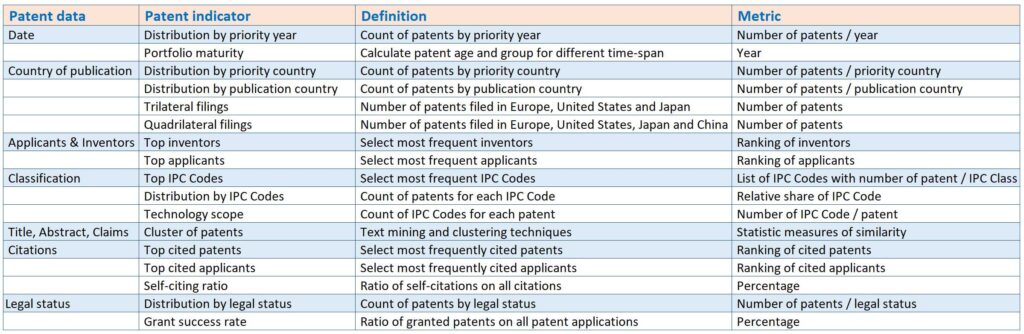
Patent indicators, primarily formed from the structured data in patent documents like filing dates, countries of publication, legal status, and citations, offer an objective view of a company’s patent portfolio from various angles. Recent advancements have seen the emergence of a new generation of patent indicators. These newer indicators delve into the full text of patents to extract vital information such as key terms and groups of similar patents, with their findings often presented in the form of patent maps.
Moreover, the advent of extensive patent databases has significantly improved the scope for systematic data gathering on a large scale. The automated calculation of these patent indicators is particularly valuable delivering crucial information. Different areas within an organization can find varied strategic insights from specific fields of patent data, making these indicators versatile and essential tools for strategic decision-making.
Benchmarking patent indicators
Navigating the Nuances of Patent Indicators in Corporate Strategy
Patent indicators offer a multifaceted way to analyze a company’s patenting strategy, encompassing aspects like technology, marketing, and human resources. These indicators provide a detailed examination of a patent portfolio’s characteristics. However, they are usually specific to certain fields and don’t always give a complete picture of the entire patent portfolio. Companies‘ patenting strategies can be understood through two main dimensions: patent activity and patent quality.
Patent Activity
This measures the intensity of Research and Development (R&D) efforts. A basic way to gauge this is by counting the number of patent applications, which reflects a company’s level of engagement in R&D.
Patent Quality:
Contrary to activity, patent quality evaluates the impact of these R&D activities. It’s assessed by creating an index from various patenting indicators. Recognizing different levels of patent quality, which includes metrics like grant ratio, technological scope, international reach, and citation frequency, adds depth to the valuation of patent information. Incorporating multiple indicators of quality helps reduce the margin of error in these measurements.
An interesting observation is the classification of companies with lower patent activity as ’selective patentees‘ of high quality. Often, these are smaller companies with fewer patents, yet they possess significant technological potential, indicated by the high quality of their patents. Consequently, the patenting behavior of such companies warrants close scrutiny in technological competitor monitoring, as their lesser quantity does not diminish the potential impact of their patents.
Engage with us to unlock the full potential of patent analytics in your business!